Creating a Line Segment Graphic
The following code
/*
 * File: CreateSimplePlot.java
 * Author: David Green <dgreen@uab.edu>
 * Vers: 1.1.0 09/21/2015 dgg - change from Etch-A-Sketch to Plotter
 * Vers: 1.0.0 09/10/2014 dgg - initial coding
 *
 * Credits:  (if any for sections of code)
 */

import java.awt.Color;
import java.awt.Graphics2D;
import java.awt.image.BufferedImage;
import java.io.File;
import java.io.IOException;
import javax.imageio.ImageIO;

/**
 * Code from:  http://www.java2s.com/Code/Java/2D-Graphics-GUI/DrawanImageandsavetopng.htm
 * (modifications by ...)
 * @author David Green <dgreen@uab.edu>
 */
public class CreateSimplePlot {

  static public void main(String args[]) throws Exception {

    double t;       // time
    double oldT;    // old time
    double deltaT;  // time increment
    double y;       // plot value
    double oldY;    // old plot value

    try {
      int width = 700, height = 500;

      // TYPE_INT_ARGB specifies the image format: 8-bit RGBA packed
      // into integer pixels
      BufferedImage bi = new BufferedImage(width, height, BufferedImage.TYPE_INT_ARGB);

      Graphics2D ig2 = bi.createGraphics();

      // make full image white
      ig2.fillRect(0, 0, 700, 500);

      // draw black lines
      ig2.setPaint(Color.BLACK);

      oldT = 0.;
      oldY = plotFunction(oldT);
      deltaT = 5.;


      for (t = deltaT; t < 700.; t += deltaT ) {
        y = 250.0 + 200.0 * Math.sin( (t / 200.) * 2. * Math.PI );
        ig2.drawLine((int) oldT, (int) oldY, (int) t, (int) y);
        oldY = y;
        oldT = t;
      }

      // write the resulting file
      ImageIO.write(bi, "PNG", new File("plot.png"));

    } catch (IOException ie) {
      System.out.println("Exception raised " + ie);
    }
  }

  private static double plotFunction(double t) {
    return 250.0 + 200.0 * Math.sin( (t / 200.) * 2. * Math.PI );
  }
}
produces
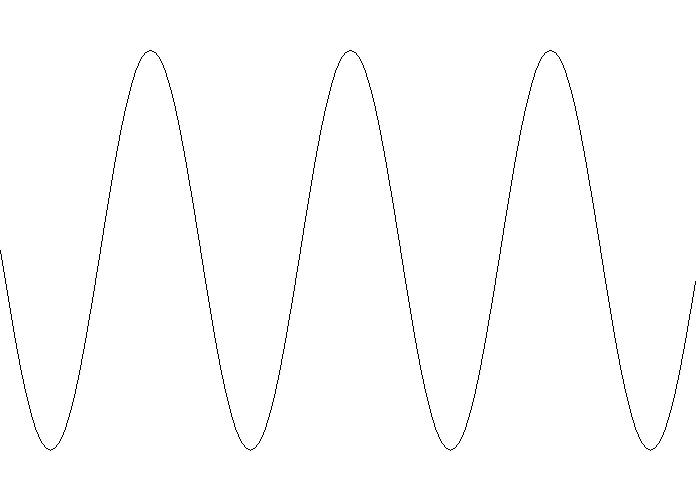
as a PNG graphic file.
Leave a comment